Advanced Destination Insights & Analytics
Get details analytics on who your best reporters are, how many issues have been reported and resolved, and more.
Another exciting feature for all the data nerds out there. 🤓
Have you ever wondered how well Marker.io is being used by your team and clients? How good is your team at addressing issues? And who are the best reporters?
With this new update, we bring answers to your questions!

Let's see how it works 👇
How many issues have been marked as Resolved?
Collecting feedback is only part of the job. To really assess how well your team is addressing issues, you need to look at how many issues have been actually marked as Resolved.
With this new update, you can see at a glance how many issues in total have been marked as Resolved for each destination.

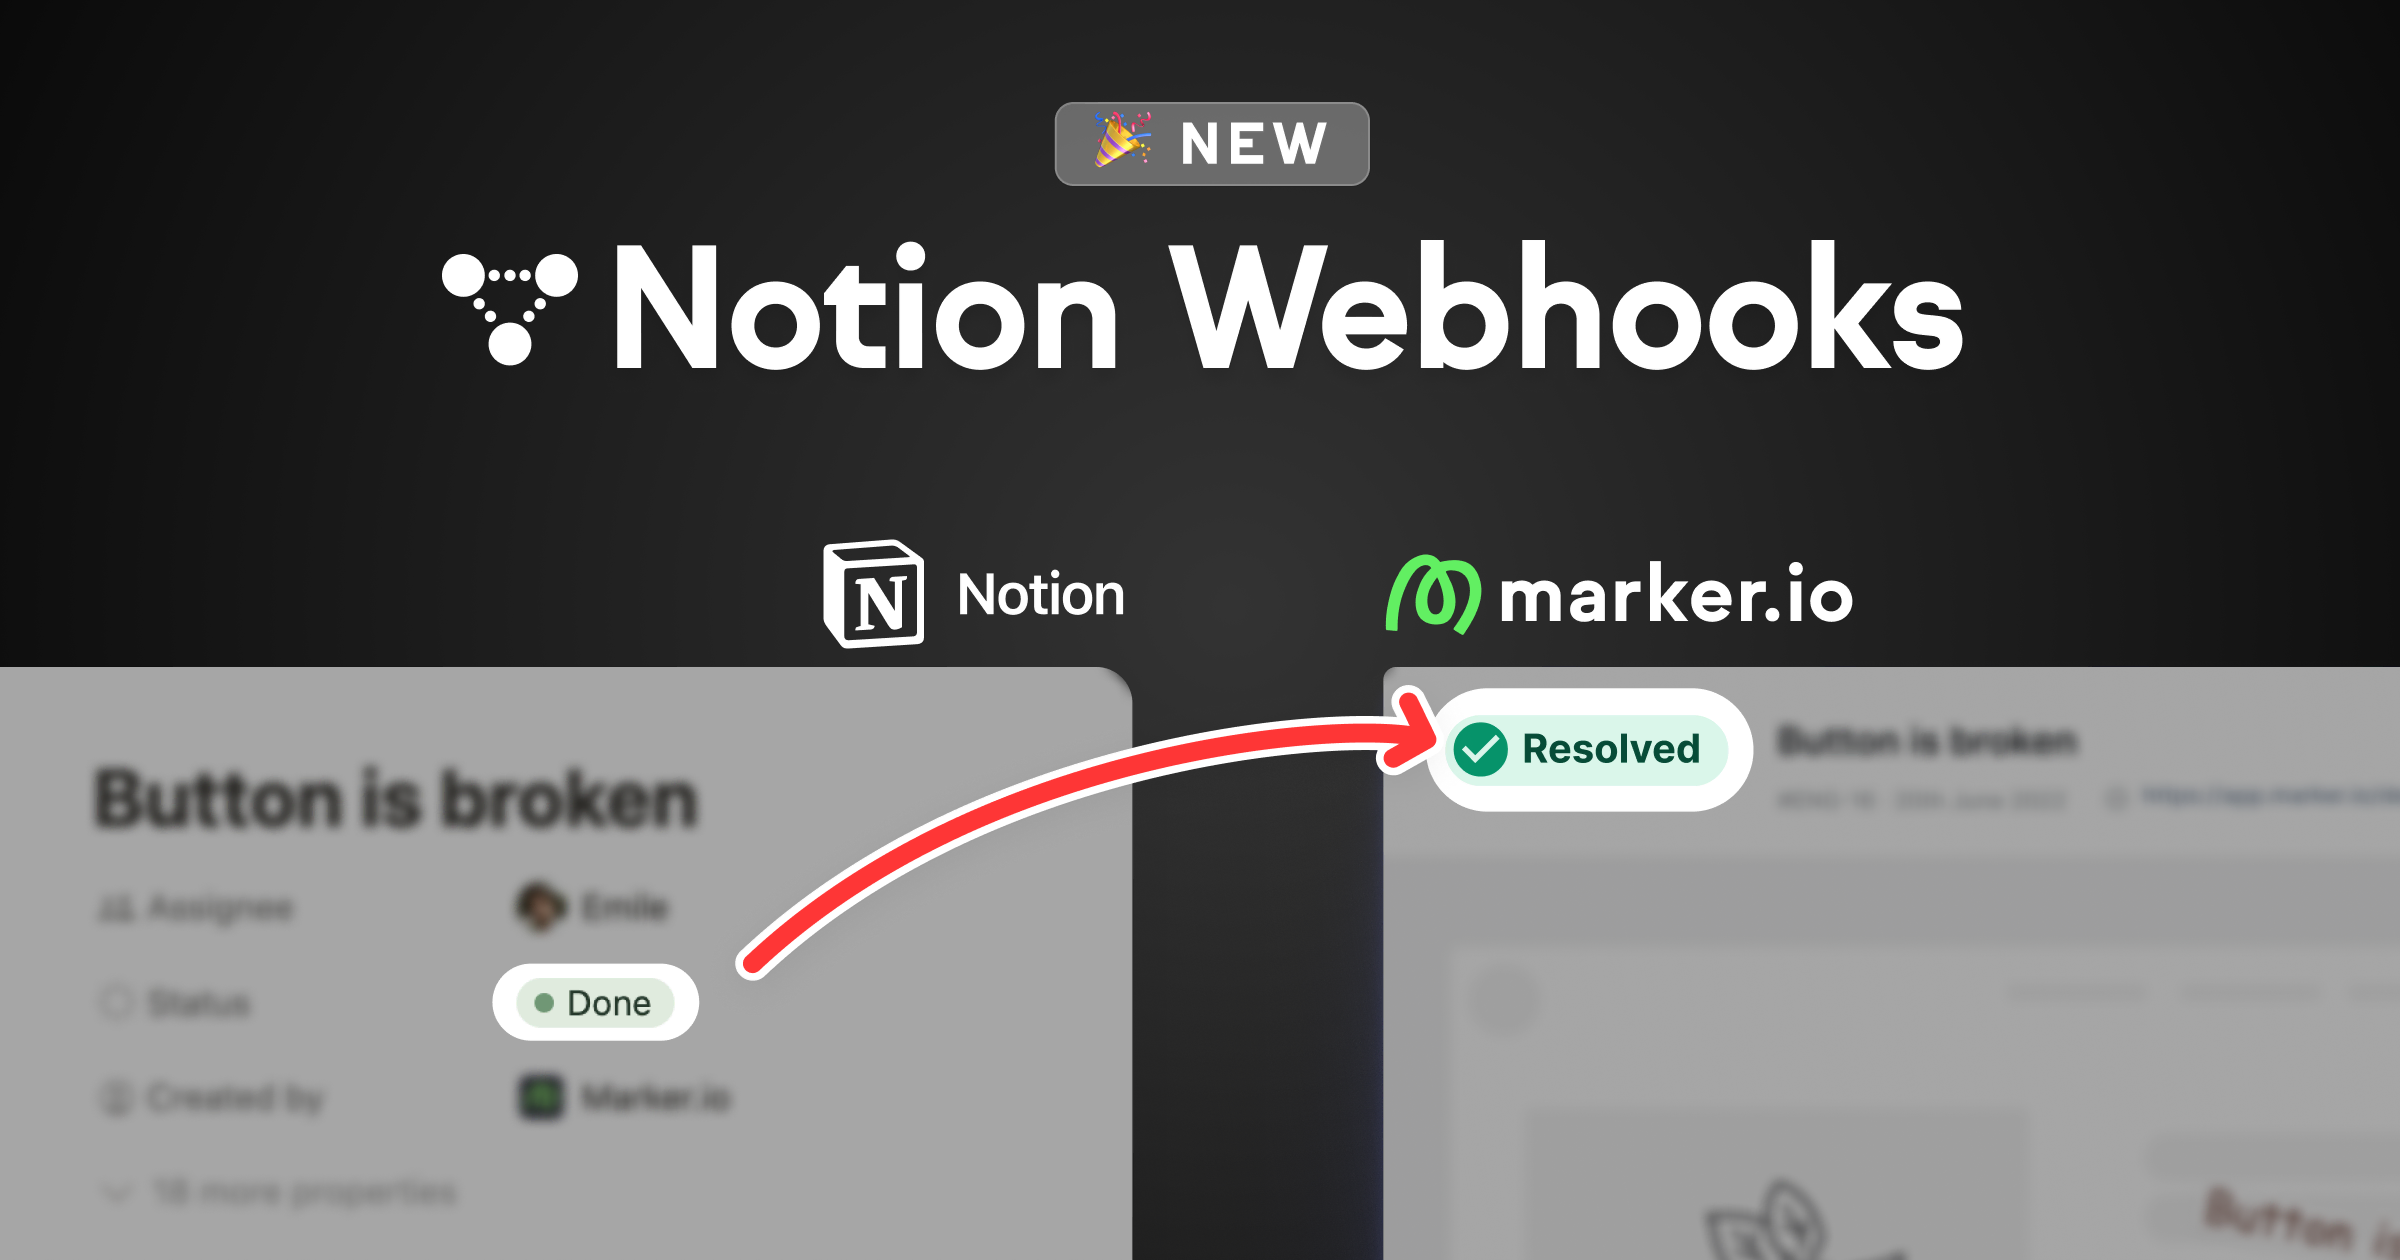
Thanks to our status auto-update feature, each time you close an issue inside your issue tracker like Jira, Trello, Asana, Teamwork, ClickUp, etc....., your issue will automatically be marked as Resolved in Marker.io!
How many issues have been reported?
Check the health of your destination with a quick glance. No need to wonder if people are actually using Marker.io!
In your graph, you'll see:
- Issues reported by Guests and Public reporters (red)
- Issues reported by Members (blue)
- The cumulative amount of issues over the last 30 days. (grey)

Who are my most active feedback contributors?
Want to thank your clients or team member, but not sure who you should actually be thanking?
You can now see the top 5 most active issue reporters over the last 30 days

How to get access?
Destination insights and analytics are available on the Team and Company plans.
To access your dashboard, log into your account, then go to Destinations > [YOUR_DESTINATION] > Settings > Dashboard.
If you would like to see other data points added, send us a message and we might consider adding them!
What should I do now?
Here are three ways you can continue your journey towards delivering bug-free websites:
Check out Marker.io and its features in action.
Read Next-Gen QA: How Companies Can Save Up To $125,000 A Year by adopting better bug reporting and resolution practices (no e-mail required).
Follow us on LinkedIn, YouTube, and X (Twitter) for bite-sized insights on all things QA testing, software development, bug resolution, and more.
Frequently Asked Questions
What is Marker.io?
Who is Marker.io for?
It’s perfect for agencies and software development teams who need to collect client and internal feedback during development, or user feedback on live websites.
How easy is it to set up?
Embed a few lines of code on your website and start collecting client feedback with screenshots, annotations & advanced technical meta-data! We also have a no-code WordPress plugin and a browser extension.
Will Marker.io slow down my website?
No, it won't.
The Marker.io script is engineered to run entirely in the background and should never cause your site to perform slowly.
Do clients need an account to send feedback?
No, anyone can submit feedback and send comments without an account.
How much does it cost?
Plans start as low as $49/mo per month. Each plan comes with a 15-day free trial. For more information, check out the pricing page.
Get started now
Free 15-day trial • No credit card required • Cancel anytime


